Wednesday, June 13, 2012

Design a Sequential Multiplier


On the previous tutorial, I was presented how the Register Transfer Level (RTL) designs methodology is successful to design a GreatestCommon Divisor (GCD) core engine.

Here again the same method I would like to apply it into sequential multiplier unit.  In the book “Fundamentals of Digital Logic with VHDL Design” by Stephen Brown & Zvonko Vranesic, they also provide one example to design this sequential multiplier. However they name it as Shift-and-Add Multiplier.


Let’ me start with design specification.
We are going to design a multiplier to multiply two an 8-bit unsigned numbers to produces 16-bit product. For example 8-bit Data A multiply with 8-bit Data B and produce 16-bit Product.

Algorithmic modelling 
In this step, we can translate the design specification to produce the behavioural model of the multiplier. This model is expressed in terms of an algorithm as shown in Figure 1, and this should be completed with IO Block diagram of the top-level system as shown in Figure 2.


Figure 1: Algorithm in Psedo-Code for sequential Multiplier for 8-bit input (n=8)


Figure 2: Top-Level of Sequential Multiplier

RTL Modelling
The RTL Model is first provided in the form of an ASM flowchart as shown in Figure 3. Then from the ASM flowchart, we can construct the RTL control sequence table in the form of an RTL Code is derived as shown in Table 1.


Figure 3: the ASM Flowchart of Sequential Multiplier


Table 1: The RTL-CS Table

Datapath


Figure 4 shows the datapath circuit for the sequential multiplier. The datapath consist of two shift registers, namely shift-left register for data A and shift-right register for data B. Other components are adder, multiplexer and register to store the Product (result).


Figure 4: Datapath of Sequential Multiplier

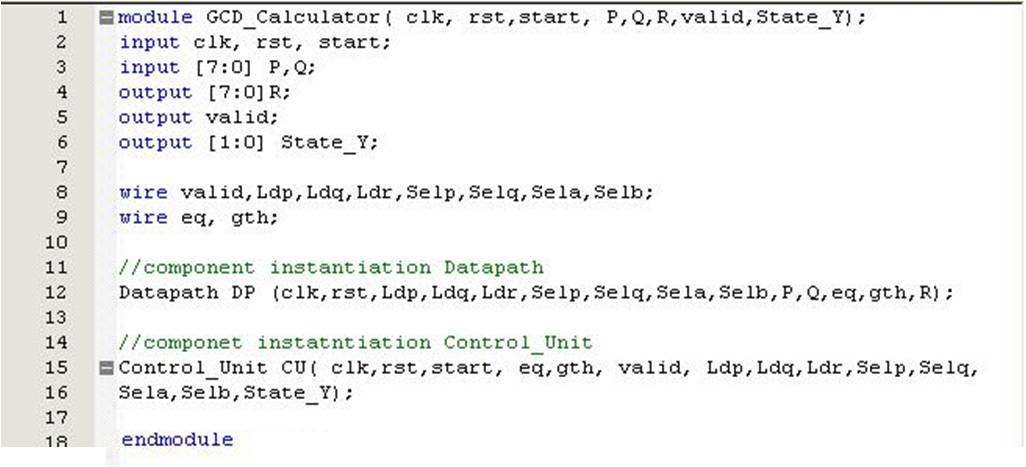
Meanwhile Figure 5 shows the top level datapath using Verilog code.


Figure 5: A Verilog Datapath code

Control Unit
The Verilog program in figure 6 shows how the control unit is constructing using Moore Model. There are three separate blocks, Next-State Logic block, State Register block and Output Logic block.


Figure 6: Verilog Code for Control Unit Sequential Multiplier

Waveform Simulation
Figure 7 show example waveform simulation to perform multiplication of hexadecimal number of FFh multiply with FFh. The product should be FE01h. In decimal number represents 255 x 255 = 65025. Inputs A and B are define as FF hexadecimal respectively. The sequential multiplier will be start the processing the data according to control unit. You can verify the state movement by State_Y output. Signal output valid will be asserted in state S3 to indicate the process of multiplication is finish and the valid result (output R) should be taken at the same clock. The state resume again at state S0.  As you can see for the worst case (FFh xFFh) the result should be ready around 18 clock cycles compare if I want to multiply 3 x 2 which is take only 5 cycles as shown in Figure 8.


Figure 7: Output Waveform Simulation for test vector FFh x FFh


Figure 8: Output Waveform Simulation for test vector 3h x 2h

Can you estimate the total clock cycles required if I would like to multiply Data A =00h with Data B= FFh ? It’s there are redundant clock have been waste? Can you do some improvement on this design? Please provide your feedback here!


Tuesday, June 5, 2012

CLOCK DIVIDER


The behaviour of describing sequential logic must be synchronized to a single edge for example posedge edge or negedge edge of the single clock.   The common synthesized sequential logics are Shift Register, Counter and Finite State Machine.

In this post, I would like to grasp your attention on how the exactly clock appears in actual waveform captured using oscilloscope compare with output produced in waveform simulator. The targeted board is ALTERA DE1 board using ALTERA’s FPGA and QuartusII Software as my synthesis tool and waveform simulator.

This ALTERA DE1 board have 50Mhz clock crystal on board. This frequency will generate Period Time 20ns as shown in Figure1 in ideal form.


Figure 1: An ideal pulse of 50 MHz

Then I use RIGOL DS1102E digital oscilloscope to capture the actual waveform and the result as shown in Figure 2.

Figure 2: Actual 50 MHz on board oscillator.

As a conclusion, the output waveform on board clock oscillator is sine waveform which is different from our thoughts, pulse waveform.  
Now came back to main issue, here I will provide the implementation of clock divider using Verilog code. Figure 3 shows the Verilog code of clock divider. If you observe carefully this code, it’s based on a counter implementation. We just change the parameter value DELAY= number. 


Figure 3: A Clock Divider

Lets say we generate clock divider with DELAY=0, so that frequency become 25Mhz. Figure 4 shows simulation waveform and Figure 5 shows actual waveform capture from oscilloscope. Surprise right!


Figure 4: A 25 Mhz output waveform from simulator


Figure 5: A 25Mhz output waveform capture from oscilloscope.

Then after I increase the value of parameter DELAY, now you can start observe the output at oscilloscope become pulse waveform.
Figure 6 shows the frequency at 12.5 Mhz , (DELAY=1). 


Figure 6: A 12.5M Hz output waveform capture from oscilloscope.

Figure 7 shows the frequency at 6.250 M Hz when DELAY=2.


Figure 6: A 6.25 M Hz output waveform capture from oscilloscope.

Now you can generate some of the delay into your design by using this clock divider by changing the parameter DELAY. Have a nice day and see you in next tutorial.


Thursday, May 31, 2012

Implementation of Shift Registers ( shift to left )


Registers are just n-bit, where n>1, structures consisting of Flip Flops. A common clock is used for each FF in the register. In this entry, the implementation of shift register is presented. The design consists of 16 bit shift to left register as shown in Figure 1.
Figure1: Shift Register to Left

Input signal en used to enable the shift operation. The data from outside shift register will be feed into the module by lsb signal. Figure 2 show the Verilog code for this Shift Register for 16-bit.  As you can notice, the used of a concantenation operator is symbolized by { }.


Figure 2: Shift_Register of Verilog Code

Figure 3 shows the simulation waveform for shift register to the left. If you notice on the output Q, the pattern seems like 2à4à8à16à32à… (decimal value) or 2à4à8à10à20à…(Hexadecimal value) for every positive edge clock triggered.  What I want to say here, this bit operation movement from right to left is equal to the data was multiple by 2 for every clock cycle.


Figure 3: The output waveform for Shift Register to left

The implementation is on DE1 board, where switch SW0 used as reset signal and switch SW1 used as en signal. The lsb signal is port at KEY1. All the outputs Q (16 bits) are assign to LEDR (7..0) and LEDG(7..0). At the same time, these output also assign to 7 segment, HEX3, HEX2, HEX1 and HEX0. in order to human eye can observe the bit movement by naked eye, I need to add clock divider to make frequency become longer compare with clock on the board. The overall block diagram to implement this design is shown in Figure 4.


Figure 4: Implementation of Shift Register to left on DE1 board.


Now enjoy to watch this following video how I demonstrate implementation of shift to left on DE1 board. 


Tuesday, May 29, 2012

Modelling Multiplexer


A multiplexer is one of the importance or ‘must’ component in the digital system generally.  The multiplexer is basic combinational logic circuits where it will be selects one of several input signals and passes it on the output. The routing of the desired data input to the output is controlled by SELECT inputs. Figure 1 show the block diagrams of 4to1 Multiplexer, where 4 inputs, 2 selectors and 1 output.
Figure 1: A Block Diagram of Multiplexer 4to1


Table 1 shows the truth table of this 4to 1 multiplexer. Then the complete equation can be generate as 
Z= ASel1Sel0 +   BSel1Sel0 +   CSel1Sel0 +   DSel1Sel0


Table 1: Truth Table for Multiplexer

In this post, I will show you a few type of Verilog code to represent a multiplexer especially in my tutorial here, multiplexer 4to1.


Boolean Equation based Modelling
On this modelling, the output signals are specified in terms of input signal transformation based on Boolean equations. This modelling style allows a digital system to be designed in terms of its function. Let’s look at Figure 2 shows a Verilog code to implement this example of Multiplexer 4to1.

Figure 2: A Combinational Logic of Multiplexer 4to1 Verilog Code


Case Statement
The Verilog case statement is similar to its counterpart in other languages. It searches from top to bottom to find a match between the case expression and a case item. The case statement executes the statements associated with the first match found, and then does not consider any remaining possibilities. Figure 3 shows how the Multiplexer 4to1 can be write in this case statement style.


Figure 3: A Multiplexer based circuit using case statement


Conditional Operator
The condition expression using the conditional operator, denoted by “?:” symbol.  The expression
“ a? b:c ”  read as: “ if a is true then the result of the expression is b else the result is c”
In Figure 4 shows example how implementation of Multiplexer 2to1 using this conditional operator.

Figure 4: Modelling a Multiplexer 2to1 with conditional operator


Then if you understand behaviour in Figure 4, now you can construct Multiplexer 4to1 using same method as shown in Figure 5a using structural modelling and purely conditional operator in Figure 5b.

Figure 5a : Structural Modelling


Figure 5b : Conditional Operator


Now you know how to construct 8to1 Multiplexer, right?


If-then-else statement
The conditional IF statement executes a statement if a condition is true. There are two other variants available: if-else and if-else-if statement.
Figure 6 shows the implementation of multiplexer 4to1 using if-else-if statement.

Figure 6: A Multiplexer 4to1 using if-else-if statement


Performance
Now, come in my mind, what about the performance for each different type of multiplexer above? Which type of style of Verilog should I apply? I believe it could be significant performance should be found. I’m not going to do some evaluation here, but based on RTL Viewer from QuartusII Tool may indicate something that needs to look further.
Let see in Figure 7, Figure 8, Figure 9 and Figure 10 shows RTL Viewer for Combinational Logic, Case Statement, Conditional Operator and If-then-else statement respectively. Probably you may some idea. Please post your comment regarding on this issue.  Thank you again.


Figure 7: RTL Viewer for Multiplexer 4to1 for Combinational Logic


Figure 8: RTL Viewer for Multiplexer 4to1 for  Case Statement


 Figure 9: RTL Viewer for Multiplexer 4to1  for Conditional Operator


Figure 10: RTL Viewer for Multiplexer 4to1   for If-then-else statement


Sunday, May 27, 2012

Finite State Machine (FSM)


Finite State Machine (FSMs) are widely used in digital systems, with their typical utilisation as the core of a datapath controller unit. Via algorithmic state machine (ASM) flowchart, an FSM is readily modelled in HDL.
In this post or probably on entire my blog, I would like to focus only on synthesizable models.
Basically there are two types of models of FSM. Moore and Mealy

In a Mealy machine, the next state (NS) and the outputs depend on both the present state (PS) and the inputs. Meanwhile, the NS of the Moore machine depends on the PS and the inputs, but the outputs depend on only the PS.

In this entry, I focus on how to design FSM based on Moore machine. Given Figure 1 below show a Moore machine, where the output Z depends only on the PS. From the flowchart, it is clear that, the FSM has 4 states, implying the minimum number of state variables is 2. Therefore two Flip Flops are required in state register.

Figure 1: ASM Flowchart of FSM


The functional block diagram of this FSM is shown in Figure 2. All FSMs have the general feedback structure. A state register (or memory) holds the values of the PS, and the value of the NS is formed from the inputs and the contents of the state register, which in this case, is consisted of edge-triggered flip-flops. 


Figure 2: Functional Block Diagram of FSM


The Verilog program describing FSM is given in code as shown in Figure 3. Coding style here has three separate coding blocks, one for the NS logic (a process block) , one for the state register (a process block), and one for the output logic ( an assign block).


Figure 3: The Verilog program for FSM


 In the QuartusII ALTERA sotware, you can depict the State Machine as shown in Figure 4 by go to ToolsàNetlist Viewersà State Machine Viewer. 


Figure 4: A State Machine Viewer Tools


It look so simple with three main function block stated in that Verilog Code. Ok have a nice day!


Tuesday, May 22, 2012

Greatest Common Divisor (Unsigned) Calculator Design


I remember this is my first design during my undergraduate studies in Universiti Teknologi Malaysia (UTM) in 2004.  On this entry, i would like to share with you how i come out a core or engine or some people say IP design. It looks simple, but it show the fundamental how we should apply some law in design our circuits using HDL.

Lets talks about the design. Here Greatest Common Divisor (GCD) is going to design using Verilog. 

The GCD calculator to be designed has the following specifications:
It computes the greatest common divisor (gcd) of a pair of 8-bit binary positive numbers. The operand registers are initialized with the activation of a start signal, which commences the computation process. Once the operation completed, a signal valid is asserted to indicate that the data on the gcd outputs are valid.

Algorithmic modeling:
In this step , the specifications are translated to produce the behavioral model of the gcd calculator. This model can be expressed in terms of an algorithm as shown below.
  1. INITIALIZE
  2. IF p>q THEN
p=p-q
ELSE IF p<q THEN
q=q-p
ELSE gcd=p
  1. END

Meanwhile the flowchart for this design shows in Figure 1.


Figure 1: Flowchart of GCD Calculator


RTL Modelling:
The behavioural model is now refined to obtain an equivalent RTL model. This model can be the form of an ASM flowchart as shown in Figure 1. From this ASM flowchart, the following RTL Code is derived:


In bold fonts, the RTL statements correspond to data operations: while the statements in italic fonts correspond to control operations.

RTL Design:
Construct the functional block diagram of the datapath unit and annotate all the control signals in the diagram. This is shown in figure 2. 


Figure 2: Functional Block Diagram of Data Path Unit GCD Calculator

Then I construct the RTL Control State table is obtained as in Figure 3.

Figure 3: RTL-CS Table for GCD Calculator


The block diagram of Control Unit GCD Calculator is shown in figure 4.


 Figure 4: block diagram of Control Unit GCD Calculator


HDL coding of the RTL design
From the functional block diagram in Figure 2, the HDL codes of  Datapath GCD calculator is now generated as shown in figure 5 below.

Figure 5: Verilog Code of Data path GCD Calculator

From the functional block diagram in Figure 3 and Figure 4, the HDL codes of  Control Unit GCD calculator is now generated as shown in figure 6 below.


Figure 6: Verilog Code of Control unit GCD Calculator

Derive the HDL coding for the top-level module by integrating this Datapath (Figure5) and Control_Unit (Figure 6) into a main module by apply structural modeling style as shown in figure 7.


Figure 7: Top-level input output block diagram of GCD Calculator

Figure 8: Verilog code of GCD Calculator Design

Simulation
In order to verify functionality of this design, I need use waveform simulation. For example, to test GCD between number 2 and 8, the result should be 2 as shown in Figure 9.


Figure 9: Waveform Simulation for GCD 2 and 8.

Now you can test a few test vector by setting a value in inputs P and Q. Observe the output R once signal valid activated.
Have a nice day!


Thursday, May 17, 2012

Structural Modelling vs Behavioral Modelling


Hi, I was asking by my student to know if there is different between structural modelling and behavioural modelling in term of logic resources and speed.

So in order to verify that question, we did some simple experiment. I want they construct a 16 bit up counter with using structural modelling and another using behavioural modelling.
In Structural modelling, we need start to construct T_Flip Flop, then followed by Four Bit Up Counter, Eight Bit Up Counter and finally Sixteen Bit Up Counter.
Basically the Sixteen Bit Up Counter consist of 2 Eight Bit Up Counter, and Eight Bit Up Counter consist of 2 Four Bit Up Counter. Meanwhile the Four Bit Up Counter is consist of 4 T Flip Flop as shown in Figure 1, Figure 2 and Figure 3.

Figure 1: Four Bit Up Counter

 Figure 2: Eight Bit Up Counter
Figure 3: Sixteen Bit Up Counter

To verify the functionality of the circuit, we need to program (download) it into the targeted device. The targeted device is Cyclone II EP2C20F484C7N using DE1 Development board. We need to add clock divider and four of seven segment components together with this Sixteen Bit Up Counter. We call it as the Top Level Design.

Figure 4: Top Level Design

To enable the counter to start count, we define switch SW0 as enable signal and push button KEY0 as a reset signal. We able to programmed it into the board.

Now we are modelling the Sixteen Bit Up Counter using Behavioural Modelling. This Verilog code you can easily get form template provided by QUARTUS II ALTERA.  Create a new blank Verilog file, then click EditàInsert Template.  In Verilog HDLàFull DesignsàArithmeticàBinary Counter. By default this design is 64 bit counter. So just change parameter WIDTH=16, to be a sixteen bit counter.


Figure 5: Template 


We did same method verification on the targeted device. This design also runs successful.
Then now the question, how we know design using structural modelling or behavioural modelling are better from the others in term of logic and speed. We can get this data from compilation report for overall design including clock divider and seven segment modules.
For structural modelling, the result shows 74 Logic elements was used and maximum frequency at 234.69 Mhz.


Figure 6: Compilation Report for Top Level Design using Structural Modelling for 16 bit Counter

Meanwhile for Behavioural Modelling the result shows 68 Logic elements was used and maximum frequency at 241.08 Mhz.

Figure 7: Compilation Report for Top Level Design using Behavioural Modelling for 16 bit Counter

As conclusion, the Behavioural modelling seems give advantage in term of resources and speed especially on this experiment by 8% reduction of Logic Element and 3 % of speed improvement.

You can verify again on my finding by reproduce again the comparison result and show to me your result.
Thanks again.